|
|
||
|---|---|---|
| blackbox/config | ||
| grafana | ||
| images | ||
| prometheus | ||
| pyPrometheusPortChecker/config | ||
| .gitignore | ||
| .travis.yml | ||
| Grafana-Org-Stats.json | ||
| README.md | ||
| docker-compose.yml | ||
README.md
Internet Service Level Agreement Monitoring Docker Stack with Prometheus, Grafana and a little python ports checker
To learn more about the python ports checker use, please visit this page: https://github.com/xeviff/pyOpenPortsChecker4Prometheus
Stand-up a Docker Prometheus stack containing Prometheus, Grafana with blackbox-exporter, and speedtest-exporter to collect and graph home Internet reliability and throughput.
This is a fork
Please, be aware this is an improvement from the following forked project, so I encourage you to get it as a first reference: https://github.com/geerlingguy/internet-monitoring
Configurations
That's easy, check the both projects configuration steps 😉
Expected result
This is how it looks like in my NAS:
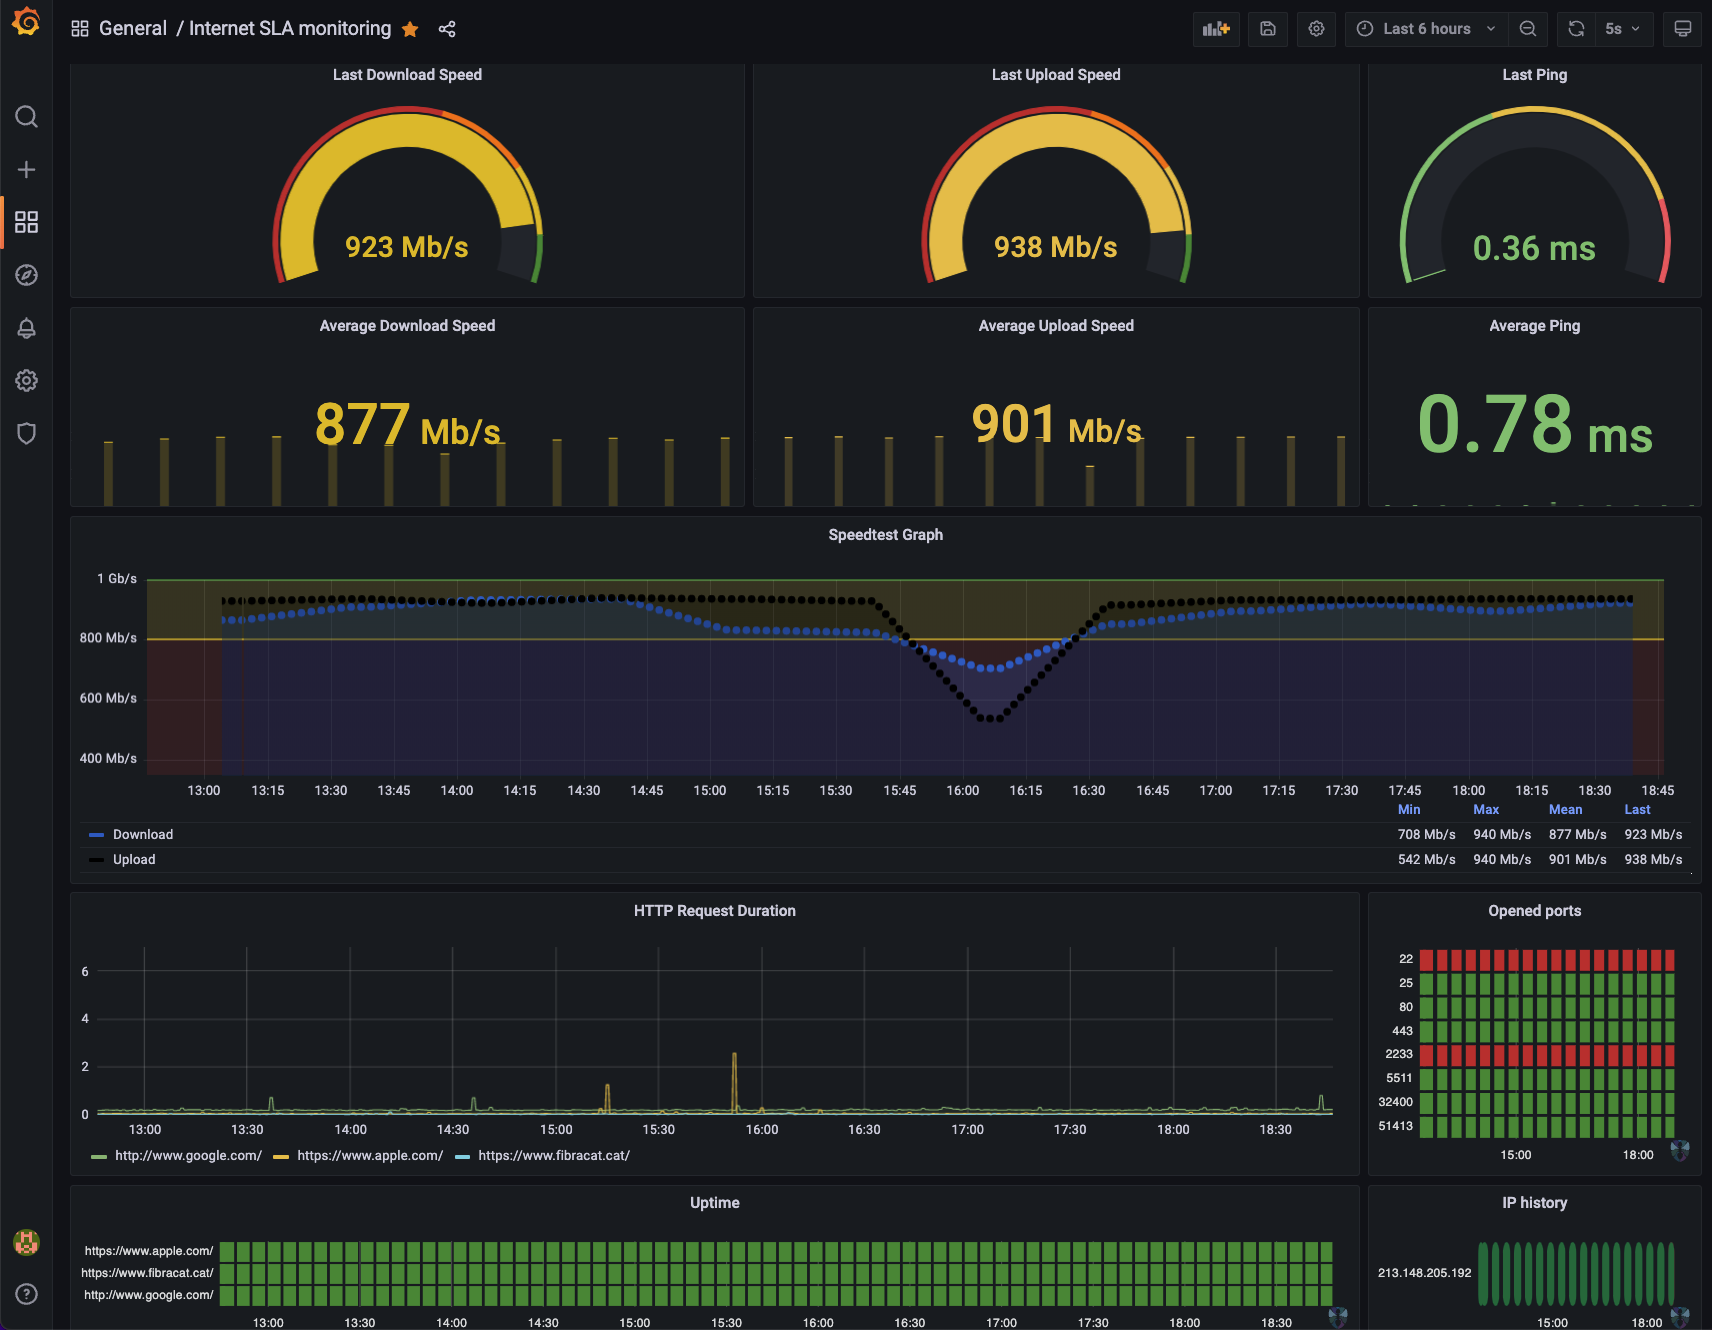
The interesting thing is you can adjust the time visibility and get its average, for example the last 24h or even last week stats, etc.
Troubleshooting
If any error don't hesitate to open an Issue and I'll check if I mess up during the merge :trollface: