1.9 KiB
Internet Service Level Agreement Monitoring Docker Stack with Prometheus, Grafana and a small python ports checker.
To learn more about the python ports checker use, please visit this page: https://github.com/xeviff/pyOpenPortsChecker4Prometheus
Stand-up a Docker Prometheus stack containing Prometheus, Grafana with blackbox-exporter, and speedtest-exporter to collect and graph home Internet reliability and throughput.
This is a fork
Please, be aware this is an improvement from the following forked project, so I encourage you to get it as a first reference: https://github.com/geerlingguy/internet-monitoring
Configurations
That's easy, check the both projects configuration steps 😉 Another important thing is the threshold for the internet speed. In my case I should have 1GB symmetrical and if one day I'll have this real speed, the colors would get the green color (but I don't expect this will happen with fibracat.cat 😤). Anyway if you had 600 Mbps for example, you'd need to adjust the Grafana's dashboard thresholds to have the green color when the values reaches 600 instead of 1000. But it's pretty easy, you (as grafana's administrator) edit the panels and change these values:

Expected result
This is how it looks like in my NAS:
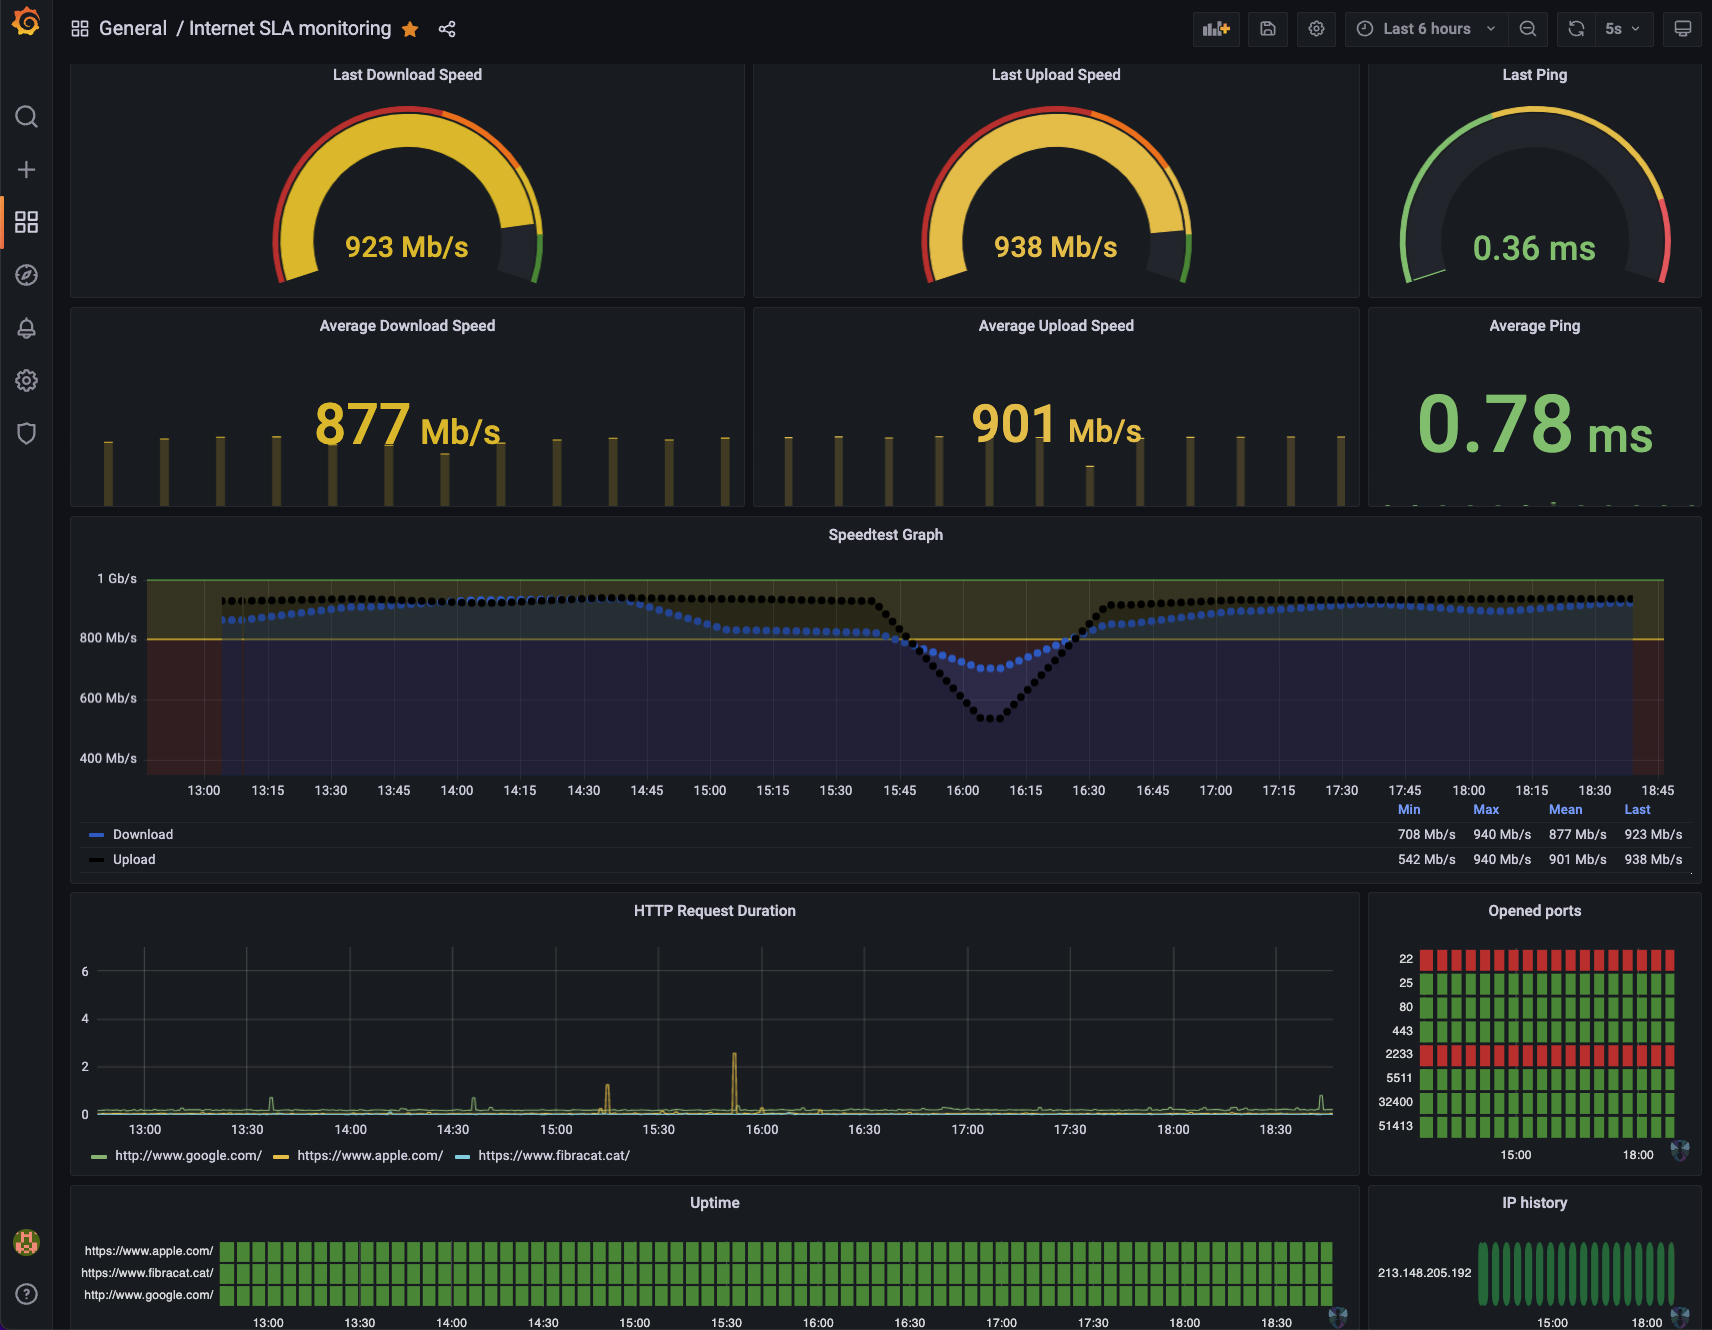
Please, don't attack my open ports 😅
The interesting thing is you can adjust the time visibility and get its average, for example the last 24h or even last week stats, etc.
Troubleshooting
If any error don't hesitate to open an Issue and I'll check if I mess up during the merge :trollface: